 MARC
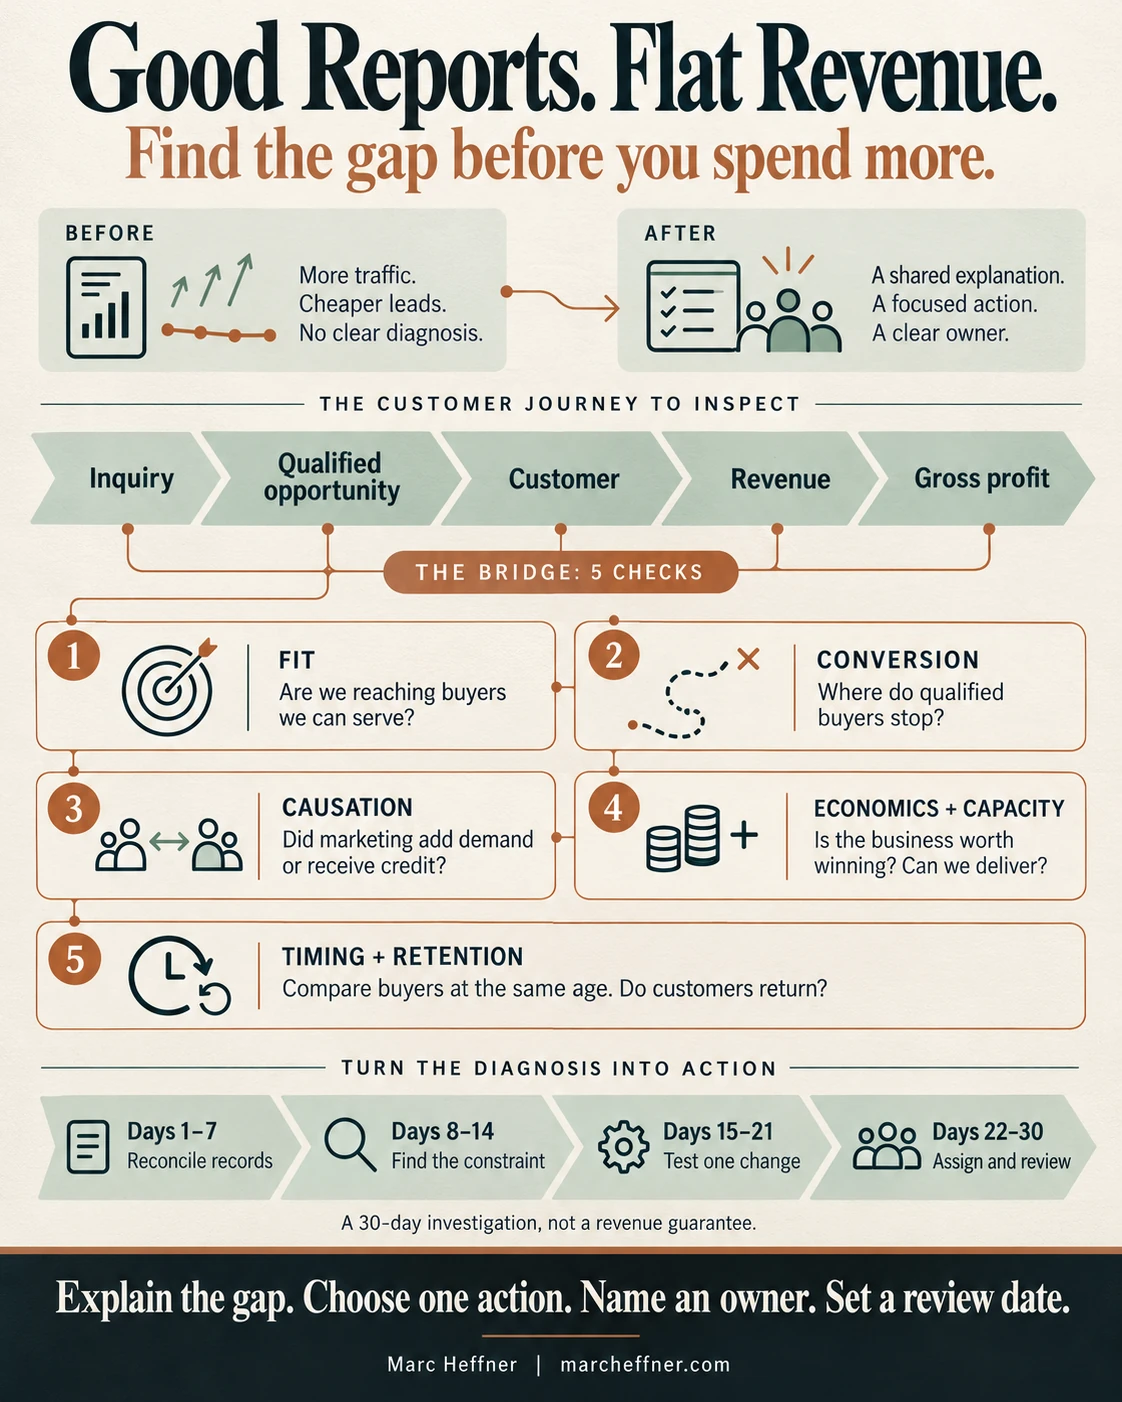
The meeting that looks successful
Starfire, an industrial equipment manufacturer, had expanded its marketing across the country. At its monthly leadership meeting, the report showed more inquiries. The cost of each inquiry had fallen. The marketing team had done what the dashboard rewarded.
Then finance presented the revenue line. It had barely moved.
The sales leader questioned lead quality. Marketing pointed to the growing inquiry count. Operations asked which products the campaign was promoting. The CEO wanted a recommendation, but the conversation kept returning to whose numbers were right.
Each team can have accurate numbers and still leave that room without a useful answer. They may be measuring different customers, different stages, or different periods. They may also be using the same word, such as conversion, to mean different things.
This is where marketing leadership has to connect the work. The job is to explain how a person becomes a customer, where that path is breaking, and which decision will help the business move forward.
At Starfire, the first useful move was to follow the inquiries beyond the marketing report. What share became qualified opportunities? How many became customers? Had both groups been given enough time to buy?
Those questions changed the meeting. The discussion moved from defending a channel to investigating a business problem.
More inquiries. Fewer customers.
Here’s a simplified version of what Starfire’s investigation revealed. Compare two equally mature groups of inquiries. Assume every won customer places one order of equal value.
| Measure | Earlier group | Later group |
|---|---|---|
| Inquiries | 1,000 | 1,500 |
| Share becoming qualified opportunities | 20% | 10% |
| Qualified opportunities | 200 | 150 |
| Opportunity win rate | 20% | 20% |
| Customers won | 40 | 30 |
| Revenue index, earlier group = 100 | 100 | 75 |
Inquiries rose 50%. Customers fell from 40 to 30. With equal order values, revenue fell 25%. If acquisition spending stayed the same, cost per inquiry would also improve.
The dashboard celebrated a cheaper lead while the business acquired fewer customers. The arithmetic works because a smaller share of the larger inquiry pool became qualified opportunities.
Starfire’s numbers revealed a qualification gap. They didn’t establish why qualification fell. Perhaps the campaign reached a different buyer. Perhaps the offer attracted research inquiries. Perhaps qualification standards changed.
That distinction matters. A useful report exposes the question you need to investigate. It doesn’t give you permission to jump to whichever explanation your team already prefers.
Keep the channel data. Add the evidence needed to connect it to the business result.
What a useful meeting would look like
Starfire’s next leadership meeting began with the same inquiry numbers, now connected to qualified opportunities, customers, order value, and the time each group had had to buy.
Marketing could see which audience produced the extra inquiries. Sales could explain which records were rejected and why. Finance could compare the business won with the cost of acquiring it. Operations could identify products the company could actually deliver.
The CEO could now ask for a specific decision: should the team narrow the audience, change the offer, repair the handoff, or investigate the measurement?
That is the improved state we’re aiming for. It is a team that can explain the gap, choose an intervention, and give someone responsibility for checking what happens next.
A report alone hasn’t created a sale. It has made a better management decision possible. The work that follows still has to earn the result.
Here’s the bridge from the first meeting to the second.
1. Reconnect the report to the customer
Start with the buyer you intended to reach. What problem do they need to solve? What makes them a fit for your offer? What would make an inquiry commercially useful?
The U.S. Small Business Administration’s market-research guidance asks businesses to consider demand, market size, pricing, saturation, and competitive alternatives. Those questions help frame a market decision. Website traffic alone cannot answer them. [1]
For a manufacturer, fit might involve a required certification, application, distribution relationship, or production volume. For a national services firm, it might involve the company’s situation, the buyer’s authority, and its capacity to act.
Use those conditions to inspect actual records. Include won, lost, stalled, and rejected inquiries. Read the notes. Look at what buyers requested and what they received. Check whether duplicates or existing customers inflated the apparent acquisition opportunity.
Then agree on what happens at the handoff. Who owns the inquiry? What qualifies it? What is the next step? Where does the rejection reason go?
Google’s documentation distinguishes an initial lead from qualified and converted leads, using offline business data to describe later stages. It supports looking beyond a form submission. It doesn’t guarantee that your definitions or CRM records are sound. [2]
At Starfire, marketing and sales would first check why qualification changed. They would compare the audience, offer, records, and standards before asking the agency for another campaign.
Assign a response standard and an owner. Review a few records together until the handoff can be explained without competing spreadsheets.
2. Separate credit from additional demand
A buyer already knows your company, searches for its name, clicks an ad, and orders. The platform records a conversion. What has that established?
It has connected a recorded interaction with an outcome under an attribution rule. It hasn’t, by itself, established whether the order needed that ad to happen.
Attribution assigns credit. Incrementality asks how much additional business happened because of the marketing. Both questions can be useful, but they require different evidence.
Research by Brett Gordon, Florian Zettelmeyer, Neha Bhargava, and Dan Chapsky compared observational measurement with randomized Facebook advertising experiments. Observational approaches often produced different estimates of advertising effects, even with extensive user data. [3]
Thomas Blake, Chris Nosko, and Steven Tadelis examined paid search at eBay. In that setting, brand-keyword advertising showed no measurable short-term benefit, while nonbrand effects differed across customer groups. These findings concern the eBay experiments. They are not a reason to switch off every branded campaign. [4]
The management question is which important budget assumption deserves a stronger test. Are you creating demand, capturing existing intent, or paying several systems to claim the same sale?
Google describes Conversion Lift as a controlled comparison between groups that can and cannot see the ads. Account availability and study requirements vary. [5] A useful experiment needs a defined outcome, suitable comparison groups, enough data, and an observation window.
If a controlled test isn’t practical, be honest about the limits of the available evidence. An ordinary before-and-after comparison can guide a question, but outside changes can weaken a causal conclusion.
For Starfire, the next report should distinguish credited outcomes from assumptions that have actually been tested. Precision in the dashboard should reflect the strength of the evidence behind it.
3. Follow the economics and the capacity
Now look at the business being won. Are the new customers buying the products you intended to grow? What remains after the relevant costs? Can you deliver what the campaign promises?
The SEC’s financial-statement guide distinguishes revenue, cost of sales, gross profit, and operating expenses. A revenue-to-ad-spend ratio doesn’t establish profit on its own. [6]
Work with finance to define the costs needed for the decision. A media-only calculation can help tune a campaign. An acquisition decision may require a broader view of people, partners, and other spending. Label that scope clearly.
Keep new and existing customers visible. A program supported by repeat purchases can look like a strong acquisition engine even when few new buyers arrive. For a portfolio company, also distinguish underlying performance from changes in the business being measured, such as an acquisition or a new territory.
Then bring operations into the conversation. A manufacturer might generate demand for a product with a long delivery queue. A service company might attract the right buyers while lacking onboarding capacity.
Those situations call for different decisions. The team may need a different product emphasis, a clearer promise, a delivery fix, or a revised investment pace. More inquiries are useful only in the context of the business you can serve.
Starfire’s CEO needs the customer mix and delivery picture beside the campaign report. That makes it possible to discuss growth and its economics together.
4. Compare buyers at the same age
Before judging the result, check the clock.
This month’s revenue may come from buyers who entered the process months ago. A recent campaign may have created opportunities that haven’t had time to close. Putting both lines on the same slide doesn’t make them the same group of buyers.
Google’s conversion-lag guidance recognizes the delay between an ad interaction and a conversion. It notes that incomplete reporting can make recent cost per acquisition appear higher and return on ad spend appear lower. [7]
For the broader business, I recommend following cohorts: groups defined by when they entered the buying process. Compare their progress at the same age. Keep that view beside the current revenue report, which answers a different question.
The numerical example earlier assumes equally mature cohorts. Without that condition, fewer completed sales in the later group could partly reflect less time to buy.
Timing should remain a testable explanation. If the sales cycle lengthens, inspect where opportunities stall. If an investment needs time, define the early evidence, review window, and conditions for changing course.
Patience needs a plan. So does urgency. Both should be grounded in the buying process you actually have.
Put the next decision on one page
Bring six questions into the executive review. Keep the detailed operating measures available for the people who need them.
| Question | Evidence to review | Decision it helps frame |
|---|---|---|
| Are we reaching buyers we can serve? | Qualified opportunities by segment and source | Audience and offer |
| Where are buyers stopping? | Stage conversion, stalled records, rejection reasons | Handoff and sales process |
| What business are we winning? | Customers, order value, and gross profit by group | Segment priorities |
| What does acquisition require? | Spending with an agreed cost scope | Investment allocation |
| Have buyers had time to act? | Cohort age and sales-cycle distribution | Review timing |
| Are customers staying and buying again? | Retention and repeat business on a defined basis | Customer experience |
Add the plan, explanation, owner, and next action. Define the denominator behind each rate. A win rate means little if the people in the room are counting different opportunities.
Review important segments beside the total. An average can hide deterioration in a priority market. A small segment can also move sharply because of a few records. Check the counts before making a large investment change.
The scorecard earns its place when it changes a decision. If it only gives every team a better defense of its own work, keep revising it.
Give the owner enough authority
Accountability needs more than a name beside a metric. The person coordinating this work needs access to the records, permission to bring the teams together, and a clear route for resolving disagreements.
Starfire’s marketing team can change the audience and campaign message. Sales can change follow-up and record the reason an opportunity stops. Finance can define the cost view. Operations can explain delivery constraints. The CEO decides when those priorities conflict.
Write down which decisions each person can make. Also name the decisions that require executive approval, such as changing a major budget commitment or shifting demand toward another product line.
Then close the loop. At the next review, ask what was done, what the evidence shows, and what remains unknown. If the team couldn't act, establish whether it lacked capacity, information, or authority. Those are different problems.
This is why I treat the reporting gap as an operating question. A useful measurement system has to connect people who can make and carry out the decisions it reveals. Otherwise, the report can become more accurate while the work stays stuck.
Make the next 30 days count
Use the first month to establish a diagnosis and a next test. The timing of any revenue effect depends on the intervention and the buying cycle.
Days 1–7: reconcile the basics. Bring marketing, sales, finance, and operations together. Define the business question and the key stages. Compare a sample of CRM records with business records. Note duplicates, missing steps, and mismatched definitions.
Days 8–14: locate the constraint. Compare segments, sources, products, and equally mature cohorts where data allows. Review wins and losses with the people doing the work. Choose the strongest explanation, then look for evidence that could prove it wrong.
Days 15–21: choose one intervention. Narrow an audience, change an offer, repair routing, or test a material attribution assumption. Define the expected signal and review window before making the change. Changing five things together makes the learning harder to interpret.
Days 22–30: establish the review rhythm. Name an owner with the authority and resources to act. Record the decision, what changed, what remains uncertain, and the evidence needed to continue, revise, or stop.
This is a proposed management process, not a promise of a turnaround in a month. Its immediate purpose is a clearer decision and a disciplined way to learn.
Back in the room
Return once more to Starfire’s opening meeting. The inquiry count is still up. Revenue still needs work. The useful change is what the team can now explain.
It can show which buyers arrived, where they stopped, which results are mature, and what the economics allow. The CEO can approve a focused action and ask for a review of the evidence.
That’s the kind of meeting I want marketing leadership to create. Marketing is a team sport. The report should help the team make a shared decision and follow through on it.
You can explore my selected work and operating examples for more of that perspective.
Questions CEOs ask
Why are leads rising while sales are flat?
Inspect customer fit, qualification, stage conversion, order value, and timing. Check duplicates and existing-customer inquiries too. More leads can coexist with fewer customers when a smaller share becomes qualified business.
Does high ROAS prove profitable growth?
No. ROAS compares attributed conversion value with advertising spending. Profit depends on additional costs, and attribution alone doesn’t establish that advertising caused the sale. Agree on the economics and evidence needed for the decision.
Should we cut marketing immediately?
Investigate the constraint first. The right response might be to stop weak spending, preserve a productive program, change the offer, or fix a problem later in the journey. Use mature outcomes and customer economics to guide the choice.
Who owns the scorecard?
A named executive should coordinate it. Marketing, sales, finance, and operations should own their definitions and actions. The leader needs access to reliable records and authority to resolve the decisions the report exposes.
What should improve in the first month?
Aim for a verified diagnosis, a focused intervention, and an agreed review plan. Revenue may take longer. Define early signs of progress and the outcome window before treating a short-term change as success or failure.
The next report should help you explain the gap and choose what happens next.
References and context
- U.S. Small Business Administration. Plan your business: Market research and competitive analysis. Guidance on demand, market conditions, pricing, customer research, and competition.
- Google Ads Help. About qualified leads and converted leads. Product documentation describing later lead stages and the use of offline business data.
- Gordon, B. R., Zettelmeyer, F., Bhargava, N., and Chapsky, D. A Comparison of Approaches to Advertising Measurement: Evidence from Big Field Experiments at Facebook. Author manuscript, April 2018; published in Marketing Science, 2019, 38(2), 193–225, doi:10.1287/mksc.2018.1135. The finding concerns the experiments and measurement approaches studied, not every marketing report.
- Blake, T., Nosko, C., and Tadelis, S. Consumer Heterogeneity and Paid Search Effectiveness: A Large-Scale Field Experiment. Author manuscript, August 2014; published in Econometrica, 2015, 83(1), 155–174, doi:10.3982/ECTA12423. Findings are specific to the eBay experiments and customer groups examined.
- Google Ads Help. About Conversion Lift. Product documentation on treatment/control comparisons and incremental conversion measurement. Availability varies.
- U.S. Securities and Exchange Commission. Beginners’ Guide to Financial Statements. Educational explanation of revenue, cost of sales, gross profit, and operating expenses.
- Google Ads Help. About conversion lag reporting. Product documentation on delayed conversions and interpretation of recent CPA and ROAS.
The research findings and product descriptions above are distinguished from my recommended management process. Starfire is an illustrative example of the reporting problem and diagnostic process. The calculation uses equally mature groups and equal order values. Your company’s results may differ; apply the same questions to your own customer, sales, and financial records.