 MARC
MARC
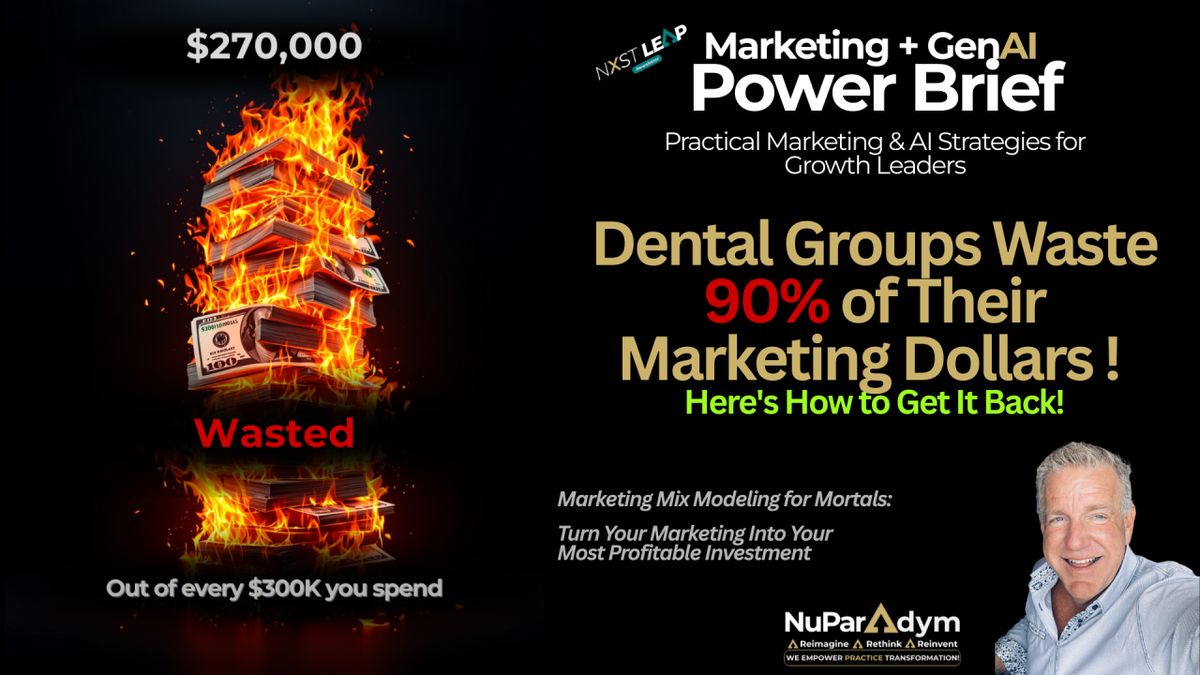
The $300,000 Question Every Dental Executive.
Should Be Asking (But Isn't)
Picture this: You're spending $300,000 annually on marketing across your dental practices. Google Ads. Facebook campaigns. SEO retainers. That fancy billboard near the highway. Sponsoring the local Little League team. Maybe some direct mail.
Now answer this honestly. Can you tell me, right now, with confidence, which of those investments actually generates profitable new patients and which ones are just burning cash?
Sound familiar? You're spending hard money on marketing but can't prove which dollars actually work. The good news: you can fix this in 90 days. No data science degree required.Download the 90-Day Quick Start Guide Now!
If you hesitated, you're not alone. Most multi-practice dental groups are flying blind, making six-figure marketing decisions based on gut feelings, vendor promises, and whatever worked (or seemed to work) last year.
Here's the uncomfortable truth:
Research shows that practices focusing solely on performance marketing leave approximately 90% of potential ROI unrealized. That means if you're spending $300,000 and getting $450,000 back (a respectable 1.5:1 return), you could actually be getting $4.5 million if you knew what you were doing.
That's not a typo. That's the power of Marketing Mix Modeling.
"But wait," you're thinking. "MMM sounds like something only Fortune 500 companies with data science teams can do."
Wrong. And I'm going to prove it.
Download the week-by-week roadmap to see the full breakdown.
What Marketing Mix Modeling Actually Is (In Plain English)
Let's strip away the jargon and consultant-speak. Marketing Mix Modeling is a statistical method that answers three critical questions about your marketing:
- Question 1: What's actually working? Which channels, campaigns, and tactics drive patient appointments and revenue? Not which ones get clicks or impressions; which ones put butts in chairs and dollars in the bank.
- Question 2: What's not working? Which activities waste budget that could be reallocated to high-performers? Where are you throwing good money after bad?
- Question 3: What should you do next? If you have an extra $50,000 to spend, where does it go for maximum return? If you need to cut $50,000, what do you eliminate with minimal damage?

MMM does this by separating two types of results:
Baseline Results are what you get without advertising: your brand reputation built over years, word-of-mouth referrals from happy patients, your location advantages, and patients who'd come anyway. For established practices, this is typically 60-80% of your patient flow.
Incremental Results are what specific marketing campaigns directly generate. If your Google Ads campaign costs $10,000 and generates 50 new patient appointments that wouldn't have happened otherwise, those 50 are incremental lift you can attribute to that investment.
The magic happens when you can measure both accurately, then optimize your spending to maximize total results.
Think of it like GPS for your marketing budget. Instead of wandering around hoping you're heading the right direction, you get turn-by-turn directions showing exactly where to go.
Need help setting up tracking? Grab the implementation guide .
The Real-World Proof: What Actually Happened When Organizations Implemented MMM
Before we talk about how to do this, let's look at what happens when you do it right. These are documented case studies, not hypotheticals.
Case Study #1: 100-Location Dental Group's AI-Powered Transformation
A regional dental organization with 100 locations implemented comprehensive Marketing Mix Modeling combined with AI-powered diagnostic tools. They integrated data tracking across 470,000+ patients to measure the true impact of their technology investments on marketing performance.
The results?
They discovered something fascinating about how operational improvements multiply marketing effectiveness. When practices used AI-powered diagnostics to show patients visual evidence of dental issues, two things happened:
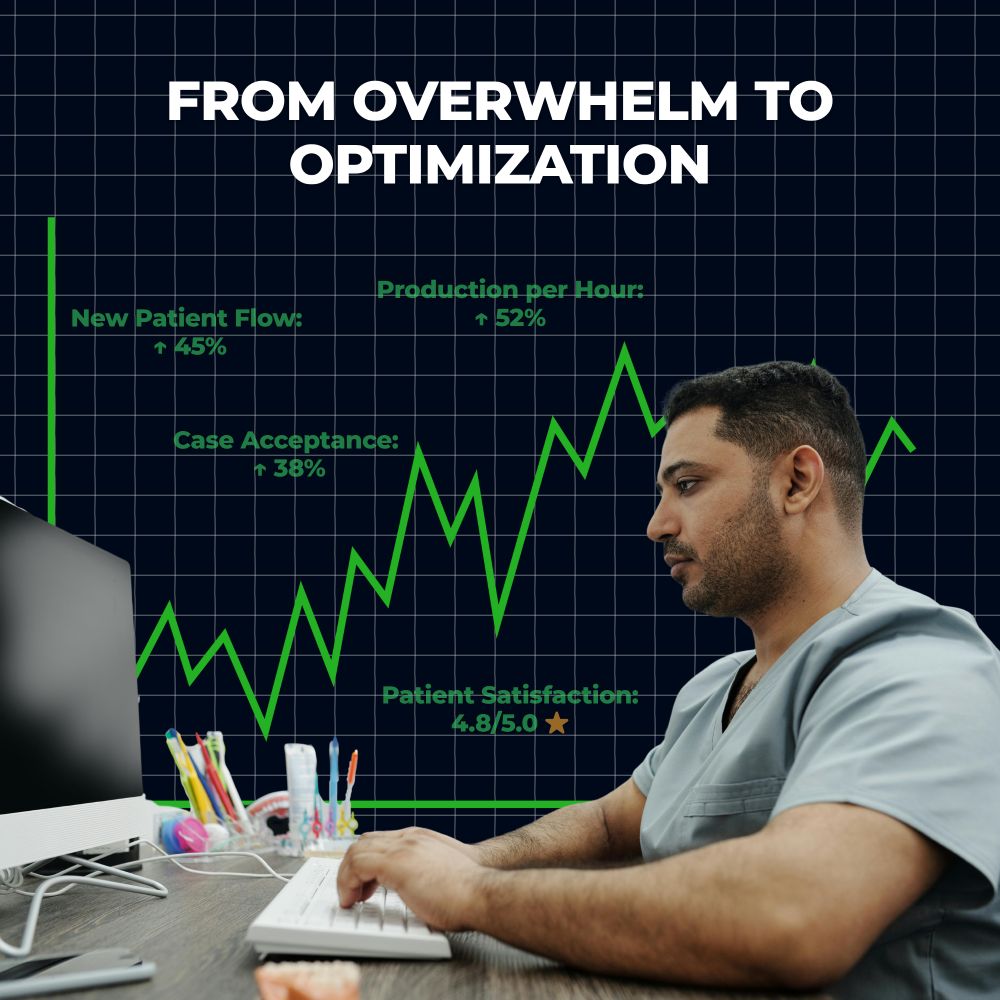
First, immediate revenue impact: The average practice saw a 13% rise in annual net production for restorative and periodontal treatments, representing $78,268 in additional revenue per practice.
This came from higher case acceptance rates: patients could actually see the problem areas on AI-annotated images, making them more likely to accept recommended treatment.
Second, the multiplier effect on marketing: Here's where it gets interesting. Practices using AI diagnostics saw their online reviews improve dramatically.
Why?
Because patients who understand their diagnosis and accept treatment become satisfied patients who leave positive reviews; more positive reviews = higher Google rankings and better reputation = more new patients from the same marketing spend.
The model revealed: practices with AI-enhanced patient experiences showed 15-20% better patient acquisition from the same Google Ads budget compared to practices without. Not because the ads changed, but because the practice's online reputation and patient satisfaction scores improved, making every click more valuable.
They reallocated budget from low-performing traditional media to high-ROI digital channels, while simultaneously investing in technology that multiplied the effectiveness of all marketing. The combination transformed their market position entirely.
That's the power of measurement. When you know what works, you can do more of it. Want the step-by-step process? We built a practical guide that walks you through implementation week by week. →Get Your Free Implementation Roadmap ← Now let's look at what happened when a single practice applied these same principles.
Case Study #2: Single Practice → $500K+ Recurring Revenue
A PPO-dependent dental practice was trapped in the typical cycle: high volume, low margins, unpredictable cash flow. They implemented Marketing Mix Modeling to understand what actually drove profitable patient acquisition and retention.
The data revealed something shocking: their most expensive patients to acquire (through paid advertising) were also the least loyal and had the lowest lifetime value. Meanwhile, their membership program patients, who cost almost nothing to acquire after the initial investment, delivered 3-4x the lifetime value.
They pivoted strategy completely, reallocating marketing spend from chasing new PPO patients to building their membership base. Within 18 months:
- Built $500,000+ in annual recurring revenue from membership fees
- Improved case acceptance rates by 35% (members trust more, buy more)
- Reduced marketing cost per acquisition by 60% (referrals from happy members)
- Created predictable cash flow through a subscription model at $30-60/month per patient
The transformation came from measurement: once they could see which patients were actually profitable, they stopped wasting money acquiring unprofitable ones and doubled down on the winners.
The EBITDA Multiplier: Why Your CFO Will Actually Love Marketing
Here's a number that'll wake up your board: Improving EBITDA by just $200,000 annually adds $1.6 million to your enterprise value at an 8x multiple.
Most dental executives think about marketing as an expense line item. Something to tolerate. Something that competes with "real" investments like new equipment or location expansion.
But here's what private equity firms figured out years ago: smart marketing doesn't just grow revenue; it multiplies EBITDA, which multiplies valuation, which multiplies everyone's wealth.
And Marketing Mix Modeling is how you prove it's happening.
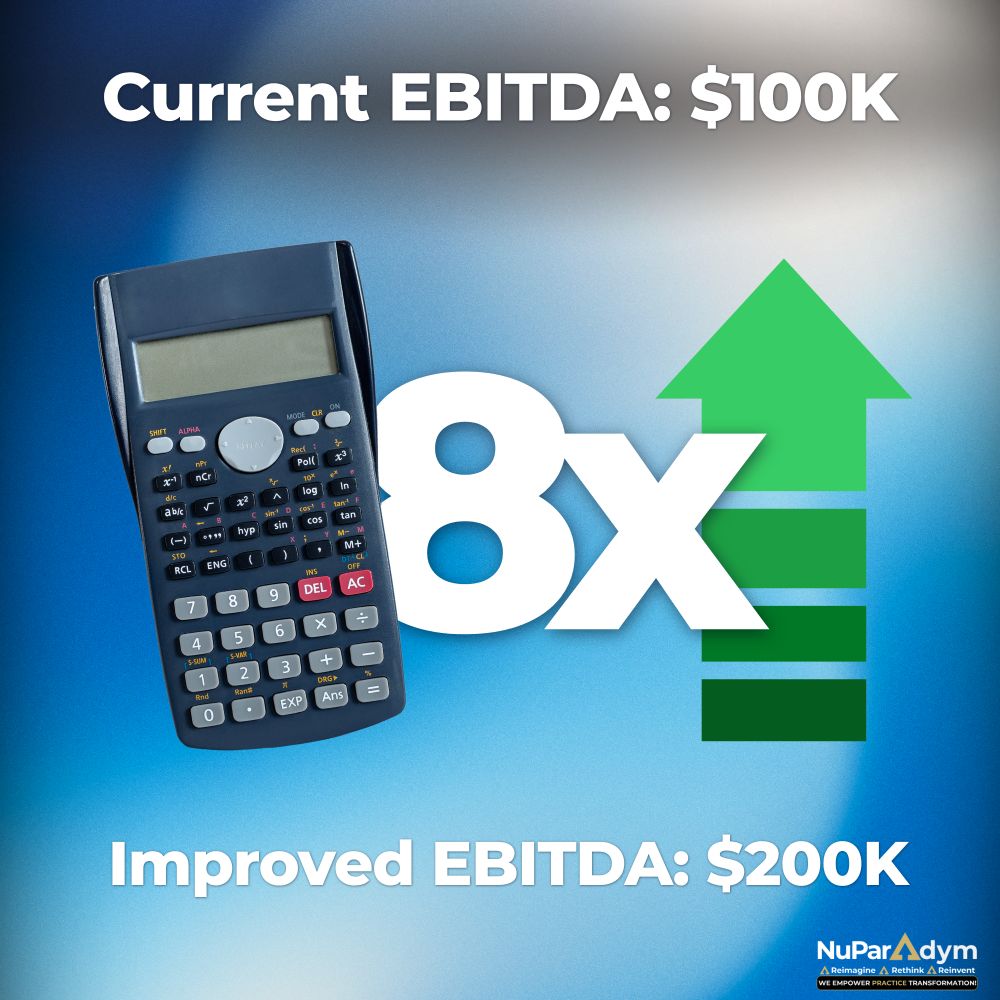
The math is clear. Better marketing measurement increases EBITDA. Higher EBITDA increases enterprise value. It's not just smarter marketing. It's wealth creation. The framework for building this is surprisingly simple. → Get the Step-by-Step Implementation Guide ← Here's exactly how to implement it, starting this week
Why PE Firms Suddenly Care About Your Marketing
The dental industry's money game changed in 2023-2024. Private equity isn't just buying practices anymore; they're demanding organic same-store growth. Why? Because they've run out of easy acquisition targets, and buying practices at 10-12x EBITDA only works if you can improve the EBITDA at existing locations.
Translation for normal humans: Your practice's value isn't just about revenue anymore. It's about profitable revenue. It's about proving you can grow earnings without burning cash. It's about showing investors you're not just busier; you're more efficient.
That's EBITDA (Earnings Before Interest, Taxes, Depreciation, and Amortization). It's the cleanest measure of your practice's operating profitability, and MMM directly improves it through three pathways.
The Three EBITDA Pathways MMM Creates
Pathway 1: Revenue Growth Without Proportional Cost Increase
Remember our 100-location dental group using AI diagnostics? They added an average of $78,268 in annual production per practice. But here's what matters for EBITDA: most of that was profit.
Why? Dental practices have high fixed costs (rent, equipment, salaries) and relatively low variable costs per patient (materials, lab fees). Once you cover your fixed costs, additional production drops straight to the bottom line at 60-75% margins.
The math:
- Additional revenue per practice: $78,268
- Estimated EBITDA contribution (at 65% margin): $50,874
- 10-location group improvement: $508,740 annual EBITDA increase
- Enterprise value increase (at 8x multiple): $4,069,920
That's not a revenue story. That's a wealth creation story. And it came from measurement enabling optimization, not from spending more on marketing.
Pathway 2: Marketing Efficiency = Dramatically Lower Patient Acquisition Cost
Remember the PPO-dependent practice from Case Study #2? Their data revealed they were overspending to acquire high-cost, low-loyalty patients. By pivoting their strategy to their high-value membership program, they reduced their marketing cost per acquisition by 60%.
This is not just a savings; it's a direct EBITDA multiplier.
Here's why that matters for EBITDA: In most dental groups, marketing is 4-8% of revenue. For a practice doing $2 million annually, that's $80,000-$160,000. If you can get the same (or better) results for 60% less, you just added $48,000-$96,000 straight to EBITDA without acquiring a single new patient.
But it compounds: You're not just saving marketing dollars. You're acquiring better patients (higher treatment acceptance, better retention) at a lower cost. That means higher lifetime value AND lower acquisition cost. Both improve EBITDA margins permanently.
Get the complete cost breakdown in the implementation guide.
Let's illustrate with a common scenario:
- Previous Marketing: $120,000/year spent on unmeasured channels = 200 new patients/year (at $600 per patient).
- Optimized Marketing: $90,000/year (after cutting $30k in waste) focused on high-performing, measured channels = 300 new patients/year (at $300 per patient).
The Financial Impact:
- Marketing Savings: $30,000 annually (this $30k drops straight to EBITDA).
- Additional Revenue: 100 more annual patients at $1,500 average first-year value = $150,000.
- Combined EBITDA Impact: $30,000 (from savings) + $90,000 (from new revenue at a 60% margin) = $120,000+ additional annual EBITDA
The exact formulas are in our free quick start guide .
Pathway 3: Operational Leverage Through Data
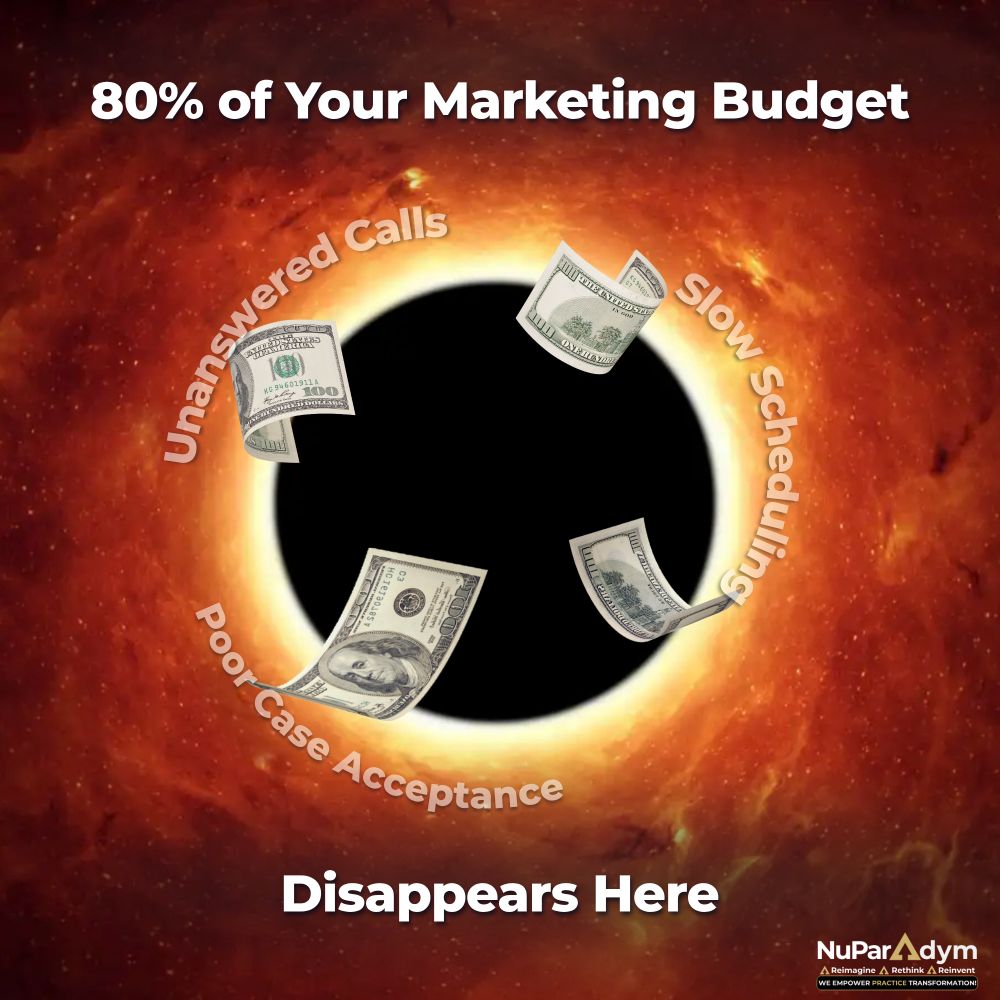
This is where most groups find hidden gold. Remember "The Black Hole of Marketing"? Up to 80% of marketing budgets wasted through operational failures.
Fixing these doesn't cost money; it makes money:
- Reducing unanswered calls from 30% to 10%: You just tripled the return on every dollar spent driving phone calls. If you spend $50,000 on tactics that generate calls, you went from $35,000 wasted to $5,000 wasted. That's $30,000 straight to EBITDA.
- Improving scheduling from 10 days to 3 days: Conversion rates jump 40%. Same marketing spend, 40% more booked patients. On $80,000 in marketing generating 200 patients, that's 80 additional patients at $1,500 average = $120,000 additional revenue = $72,000+ EBITDA.
- Increasing case acceptance from 60% to 70%: This is pure profit. Zero marketing cost. No additional clinical hours. If your hygiene department identifies $500,000 in needed treatment annually, going from 60% to 70% acceptance is $50,000 additional revenue = $32,500 EBITDA at 65% margins.
Combined operational improvements across a 10-location group:
- Call handling improvement: $300,000 recovered marketing efficiency
- Scheduling optimization: $720,000 additional revenue
- Case acceptance improvement: $325,000 additional revenue
- Total EBITDA impact: $868,000 annually
- Enterprise value increase (at 8x): $6,944,000
All from measurement revealing what was broken.
The Investor Pitch: Why This Matters for Exit Multiples
Here's what nobody tells you about practice valuations: PE firms don't just multiply your EBITDA. They multiply quality EBITDA at higher rates.
Practices with documented, systematic marketing measurement command premium multiples.
Why? Because buyers can model future growth with confidence. Random, inconsistent EBITDA? That gets 6-7x. Predictable, data-driven EBITDA with clear growth levers? That gets 9-11x.
Let's say you're a 5-location group doing $10 million in revenue with $1.5 million EBITDA (15% margins).
Scenario A: Status quo (no MMM)
- Valuation at 7x: $10.5 million
- Owners take home: ~$7 million after debt
Scenario B: Implement MMM, improve EBITDA to $2.2 million (22% margins) over 2 years
- Better margins: $700,000 annual improvement
- Higher multiple (proven systems): 9x instead of 7x
- Valuation: $19.8 million
- Owners take home: ~$15 million after debt
We include tracking templates in the free guide .
That's $8 million additional wealth from better measurement and optimization: not from buying more practices, not from working harder, but from measuring what works and doing more of it.
The Compounding Effect: Why Starting Now Matters
Here's the kicker: EBITDA improvements compound.
- Year 1: Implement MMM, improve EBITDA 10% through optimization = $150,000 increase
- Year 2: Build on optimized baseline, grow another 10% = $165,000 increase ($315,000 total)
- Year 3: Compound again = $181,500 increase ($496,500 total vs. baseline)
Over three years, that's nearly $500,000 in cumulative EBITDA improvement from a $10,000-25,000 initial investment in measurement infrastructure.
At 8x multiple: $4 million enterprise value creation. ROI on MMM investment: 16,000% over 3 years.
But here's what most executives miss:
Every month you delay is a month of compounding you'll never recover. The practice that starts MMM in January 2026 will have 12 months of compounding advantage over the practice that starts in January 2027.
You've seen the proof. You understand the value. You know this works. The only question left: when do you start? → Download Your 90-Day Roadmap Now ← Everything you need to begin is inside. Week-by-week actions. Tracking templates. ROI formulas. Real costs. Real timelines. No fluff. Just the work.
The Bottom Line for Your Board
When you present MMM to your CFO, PE sponsors, or board, frame it this way:
"We can spend the same amount we're spending now on marketing and improve EBITDA by $500,000-$1 million annually within 18-24 months. That translates to $4-8 million in additional enterprise value at exit. The required investment is $25,000-75,000 depending on our size, delivering a 5,300% to 32,000% ROI."
That's not a marketing conversation anymore. That's a wealth creation conversation. And wealth creation conversations get approved.
📥 DOWNLOAD: 90-Day Implementation Guide
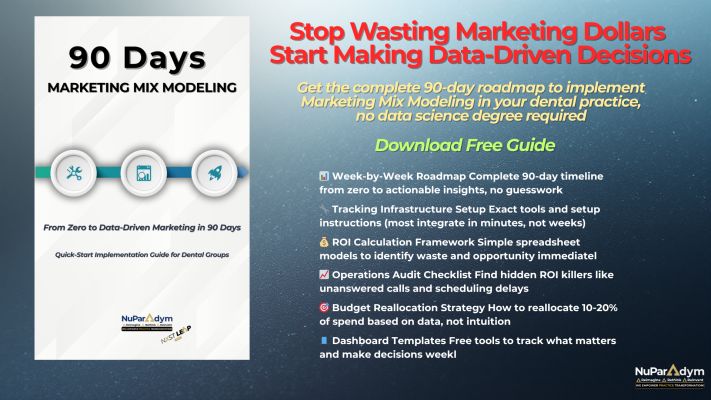
Ready to implement Marketing Mix Modeling in your practice? Download our step-by-step 90-Day Quick-Start Implementation Guide with weekly action plans, tracking templates, and success benchmarks.
Are you tired of your marketing not working, Let's talk now! Click the link. Quick Meeting
Get the breakdown in your inbox. Join the Marketing+GenAI Power Brief Today!
📲 Check out our website: NuParadym
🎥 Get more info from our YouTube Channel: NuParadym YouTube
📲DSO Marketing X Website: DSOMarketingX
📲NXST LEAP Academy: NXST LEAP Academy
About the Author